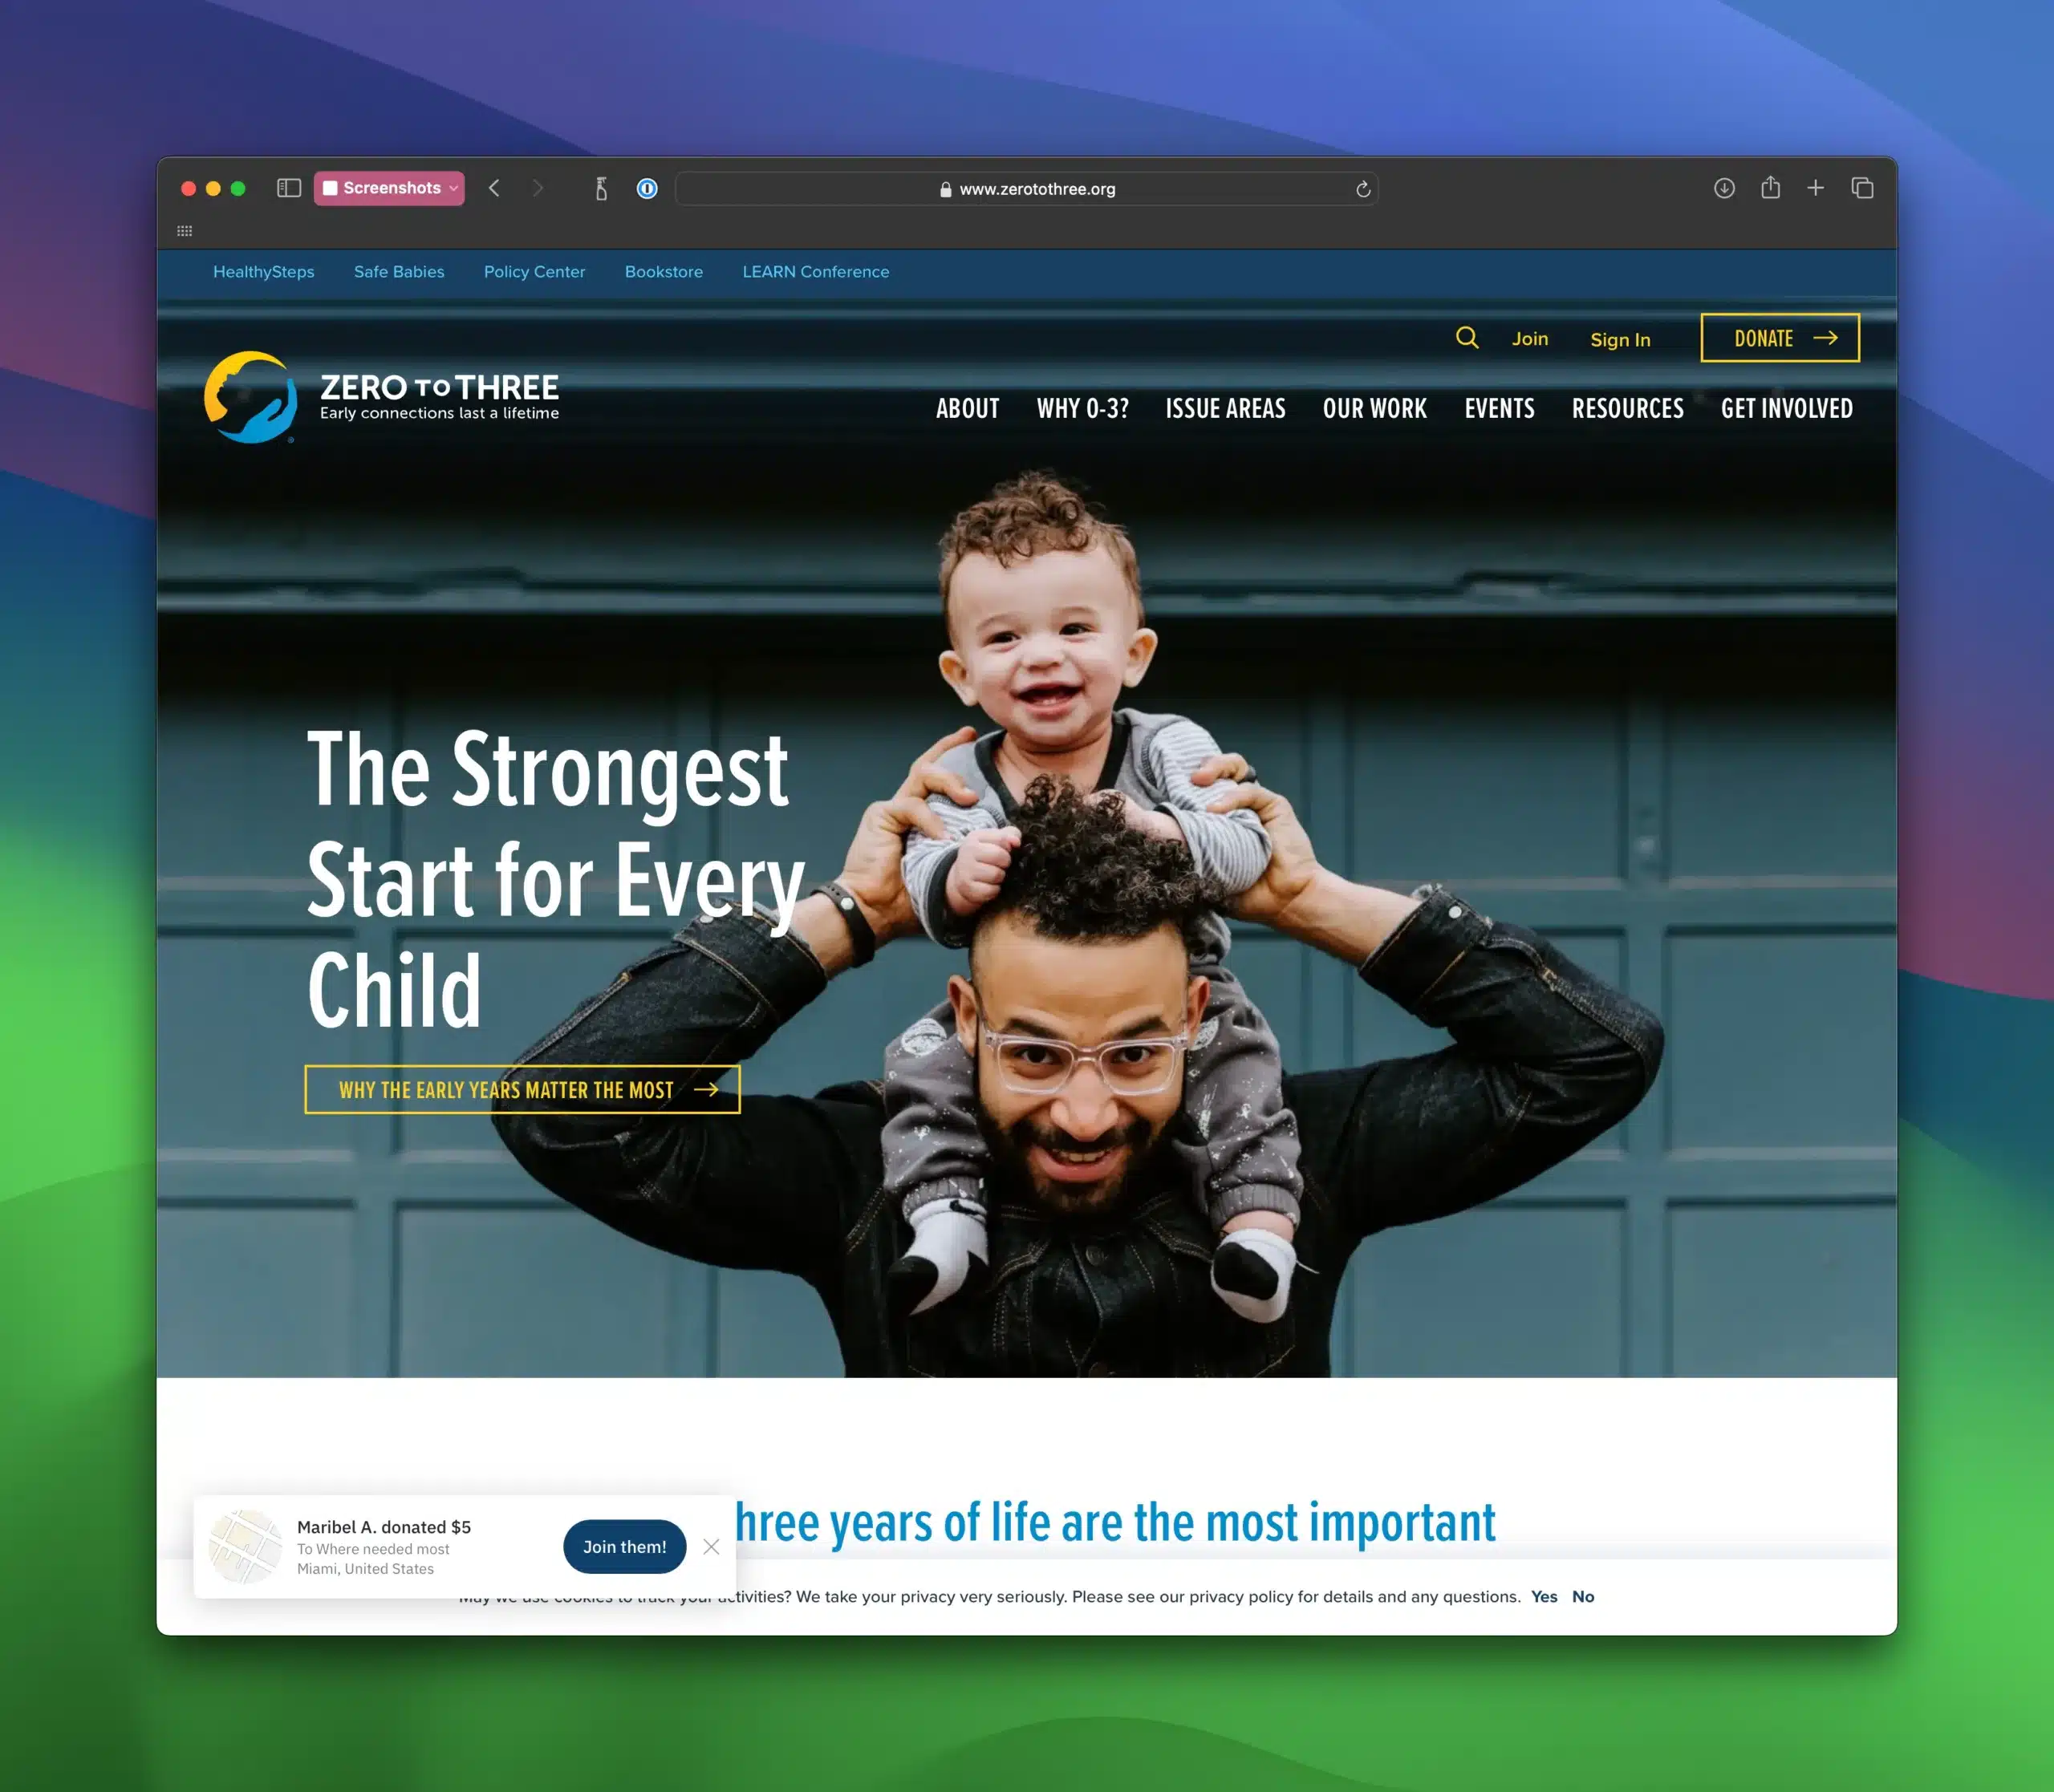
In May 2023, our client approached us because their website was slow and user experience was suffering. They had seen a steep decline in website traffic and overall visibility in search engines.
Lower traffic numbers resulted in lower direct donations for their early childhood non-profit organization, and even more critically, their website traffic was a key metric in determining their future funding from other outside donors.
Their important messaging was losing traction and they reached out to SiteCare to help save the day. Our focused efforts achieved all of the following:
- All URLs for the website achieved Good Core Web Vitals for Mobile and Desktop
- Search engine impressions increased by 35,000 impressions per month
- Website traffic increased by 7,000 sessions per month
- The website achieved higher rankings than ever before for important keyphrases
Here are some of the statistical highlights from the Core Web Vitals improvement efforts. This table compares the six months before we began working to improve performance and Core Web Vitals, and the six months after we completed our work.
| February 2023 – June 2023 | June 2023 -October 2023 | |
|---|---|---|
| Traffic | 645,000 Users | 820,000 Users |
| Search Impressions | 28.2 Million | 36.6 Million |
| Search clicks | 513,000 | 628,000 |
| Page Load Time | 🔴 28.9s | 🟢 3.4s |
| Largest Contentful Paint (LCP) | 🔴 4.6s | 🟢 2.3s |
| First Input Delay (FID) | 🔴 420ms | 🟢 57ms |
| Cumulative Layout Shift (CLS) | 🟢 0.08 | 🟢 0 |
| Interaction to Next Paint (INP) | 🔴 230ms | 🟢 133ms |
Diagnosing the Core Web Vitals Crisis
When we began, all of the URLs for both mobile and desktop were flagged as Poor in Google Search Console.
The site was earning a GTmetrix grade of F on most of the page URLs.
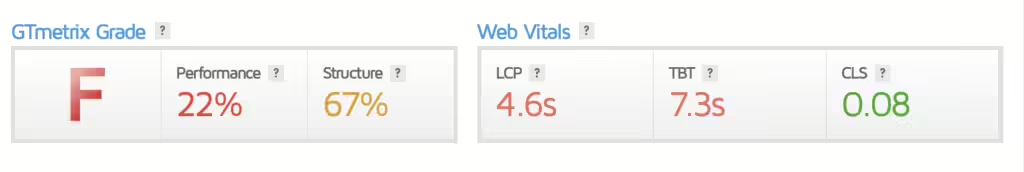
Core Web Vitals were reporting the following:
- 🔴 LCP – 4.6 – 2.1 seconds over the threshold
- 🔴 FID – 420ms – 320ms over the threshold
- 🟢 CLS – 0.08 – within required limits
Here are a few other metrics to help illustrate the performance struggles we were seeing:
- 🔴 Total Blocking Time – 7.3s
- 🔴 Total Page Size 5.33MB – 3MB was JavaScript!
- 🔴 Fully Loaded Time – 28.9 seconds (Yikes!)
We had our work cut out for us but backing away from a challenge isn’t the SiteCare way. We were confident that we could bring the site back to pre-slump levels, so we got to work.
Crafting a Cure: The SiteCare Performance Optimization Plan
During our original assessment we identified several areas that we needed to improve.
The site is built on Elementor which introduces its own challenges, and we also identified the following pieces that needed to improve:
- Replace the render-blocking Top Bar plugin with HelloBar, which doesn’t block render
- Replace the SUMO marketing platform with a self-hosted option called ConvertPro. The SUMO plugin suite introduced a huge number of third-party scripts which made the JavaScript processing time immense.
- Removed some proprietary JavaScript from their custom parent theme that was blocking render.
- Implemented DNS pre-fetching to help hero images load more quickly from one page to the next.
- Minified and concatenated files wherever possible.
- Adjusted script load order to prioritize scripts for the first page paint.
- Removed unused third-party scripts from Google Tag Manager
- Switch font libraries (Typekit and Google) to locally-hosted libraries with graceful fallback to prevent layout shifting
- Implemented image optimization via Cloudflare Polish & Mirage
From Laggard to Leader: The Dramatic Improvement in Core Web Vitals Scores
As we made steady improvements to the performance of the website, we started to see the fruits of our work in PageSpeed, Lighthouse, and GTmetrix reports.
On September 8th Google Search Console began seeing the improvements and the website traffic not only rebounded, it surpassed previous levels.

By October 100% of all of the URLs for the website had good ratings for both desktop and mobile.

Take a look at the improvement of these improvements!
Core Web Vitals:
- 🟢 LCP – 2.3 – good
- 🟢 FID – 57ms – good
- 🟢 INP – 133ms – good
- 🟢 CLS – 0 – perfect!
Here are a few other metrics to help illustrate the performance struggles we were seeing:
- 🟢 Total Blocking Time – 0.3s – 7 second reduction!
- 🟢 Total Page Size 602KB – 800% improvement!
- 🟢 Fully Loaded Time – 3.4 seconds – 1000% improvement!
On September 22nd we got this note from our client. These are the types of messages that make our day:
Many of our URLs were validated by Google over the weekend and I was holding back tears when I checked our Core Web Vitals from the plane on Monday! What an astronomical improvement!
If your website is suffering from poor Core Web Vitals and it’s losing traction, work with SiteCare to help get it back on track. Contact our team and take advantage of the Core Web Vitals promise in our SiteCare Medallion plans.