
PageSpeed Insights is the most misunderstood website performance testing tool on the planet. Yes, the interface is simple, but there’s a lot going on in the small print that can dramatically change what the report actually means in terms of WordPress performance.
In this article, I’ll walk you through every component of the PageSpeed Insights report. I’ll explain what each section of the report means, what impact it has on Core Web Vitals, if any, and how to turn the report results into real actions that will improve your website speed.
Understanding PageSpeed Insights
Developed by Google, PageSpeed Insights is a free tool that analyzes your website’s performance and user experience. Simply enter your website address and click “Analyze.” The tool then scans your website’s code, identifying areas for improvement and providing specific recommendations to optimize speed and user experience.
The tool is meant to measure overall performance as well as key user experience metrics that are part of Google’s Core Web Vitals. It’s useful to give a quick snapshot of a single point in time but it almost never paints a complete picture. We’ll cover more on this later.
Common misconceptions about PageSpeed Insights
We make a lot of assumptions about what PageSpeed Insights is and isn’t, so I’ll set the record straight. Here are some of the most common misconceptions about PageSpeed Insights:
Myth #1: PageSpeed Insights is the most important performance metric
PageSpeed Insights delivers a set of useful information to help improve website performance, but it isn’t the most important performance metric. Core Web Vitals have a direct impact on search engine rankings whereas PageSpeed Insights shares helpful performance diagnostic information. Google does not factor in PageSpeed Insights into the search rankings, but it does include Core Web Vitals.
Myth #2: Search rankings will automatically improve with good scores
It isn’t guaranteed that search engine rankings will improve with a PageSpeed Insights score of 100. Website speed is one of many factors used in Google’s ranking algorithm. We have seen many cases like this one where better performance did boost organic website traffic, but it doesn’t always. According to Google, the only metric they explicitly use in their search engine grading is Core Web Vitals.
Myth #3: Scoring 100 is always the goal
While PageSpeed Insights assigns a score from 0 to 100, achieving a perfect score isn’t always necessary or ideal. Optimizing for a perfect score can sometimes involve trade-offs that hinder user experience. After all, a blazing-fast website that’s clunky to navigate defeats the purpose. Instead, focus on Core Web Vitals (LCP, INP, CLS) which have a more significant impact on user experience.
Myth #4: Good desktop scores will automatically result in good mobile scores
Google separates mobile and desktop performance in PageSpeed Insights, running individual tests for each. This means a stellar desktop score doesn’t automatically translate to mobile glory – and vice versa. While improvements on WordPress can often benefit both versions of your site, they’re not guaranteed to be directly proportional.
Myth #5: PageSpeed Insights measures overall performance
While PageSpeed Insights is a valuable tool for identifying performance issues, its results represent a single point in time. Running the same URL just minutes apart can yield different scores, highlighting the tool’s momentary snapshot. Don’t base website performance solely on a one-time report. Remember, PageSpeed Insights only analyzes a single page – not your entire website, which could have hundreds or thousands of pages. For a more comprehensive picture, conduct regular tests and monitor overall website performance.
Myth #6: Every recommendation should be followed
PageSpeed Insights will give a number of recommendations to improve performance, but blindly following them might not be a great idea. Take ad scripts, for instance. PageSpeed Insights may flag them as performance bottlenecks, but removing this revenue stream is ill advised. Rather than removing the ad scripts, the team at SiteCare looks at optimizing loading behavior and using async loading techniques.
How PageSpeed Insights differs from Core Web Vitals
In the web performance world, there’s confusion about the difference between PageSpeed Insights and Core Web Vitals, or whether they’re different at all.
PageSpeed Insights is a diagnostic tool that takes a measurement of a web page for a single point in time.
Core Web Vitals is a cumulative measurement of LCP, INP, and CLS (explained further below) that requires specialized testing and can’t be determined with a one-time page scan.
While it might seem convenient, Google presenting Core Web Vitals data alongside PageSpeed Insights results can be misleading. New CWV scores aren’t generated during the specific PSI scan but rather reflect real-world user data from the past 28 days. This discrepancy can cause confusion, as users might mistakenly believe the CWV scores represent the current page’s performance.
The Core Web Vitals scores load instantly when a scan is started, which should be a clue that no new data collection is happening, but Google also points it out in the fine print below the results.
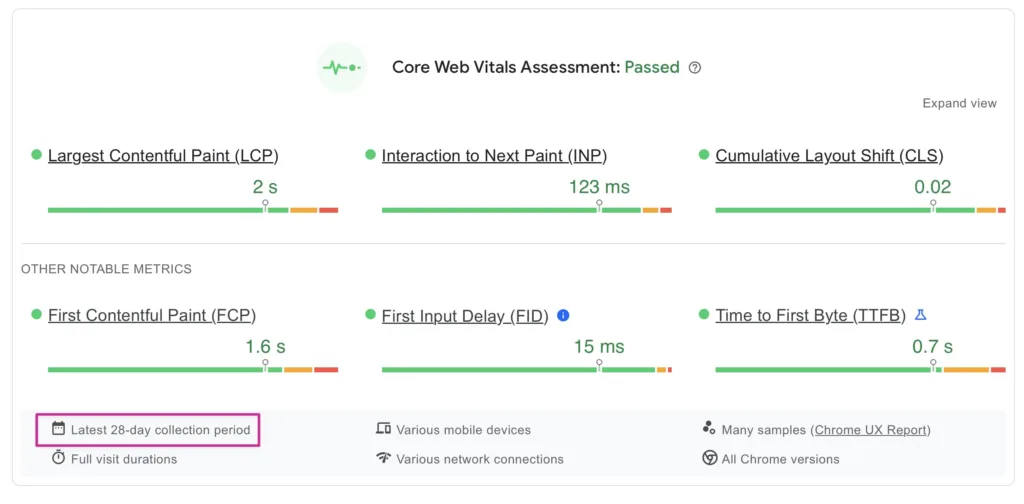
For brand-new websites with minimal traffic, Core Web Vitals data might not even be available yet, as Google requires a certain amount of visitor data for measurement.
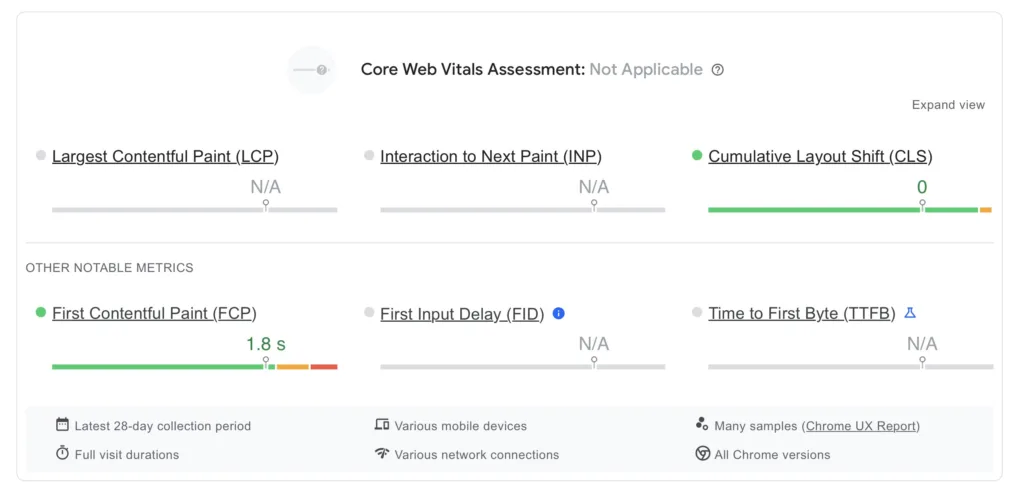
PageSpeed Insights, on the other hand, is a real-time diagnostic test for a single point in time. When a new test is run, the loading bar displays to show that fresh data is being captured.

How to interpret the PageSpeed Insights score
There’s a real formula that Google uses to build the 100-point PageSpeed Insights score.
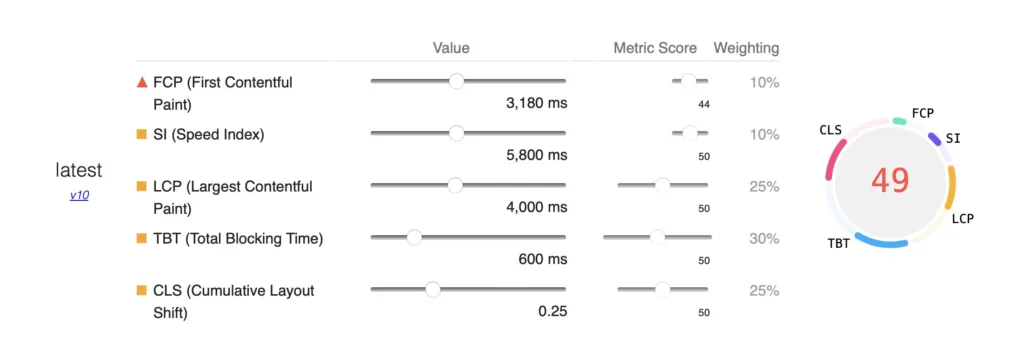
There are five different scoring areas:
- First Contentful Paint (FCP) – 10%
- Speed Index (SI) – 10%
- Total Blocking Time (TBT) – 30%
- Largest Contentful Paint (LCP) – 25%*
- Cumulative Layout Shift – (CLS) – 25%*
* Indicates that this is a Core Web Vital and is factored into Google’s search algorithm
Each scoring area can have a direct or indirect impact on the other scoring areas. For example, if a website’s TBT is reduced, it’s very likely that the FCP, SI, LCP, and CLS will all improve as well.
Here’s an overview of what each of these metrics is measuring, and how it’s factored into the overall PageSpeed Insights score.
First Contentful Paint (FCP)
First Contentful Paint is the measurement of the amount of time it takes for any content to load on the page. The measurement of time from a fully white browser screen to when the first words are output is the FCP.
FCP has the least weight in the PageSpeed Insights formula, but it directly impacts the LCP. How can the main content on a page load quickly if it takes a long time for the initial content to load? In practice, it’s rare that a page has both a poor FCP score and a good LCP score. So even though the overall impact of FCP on PageSpeed Insights is low, it’s not a metric that should be ignored when optimizing for PageSpeed Insights.
Speed Index contribution
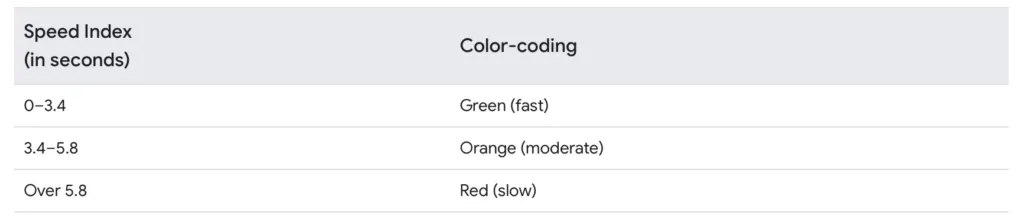
Speed Index measures how quickly content is visibly displayed during the page load. One can almost think of the Speed Index as the smoothness of how content loads on a website. If scrolling down the page creates content gaps or delays, the Speed Index is going to be worse than if the content is readily visible and available as the page loads.
This table shows the target times for performance on mobile devices. Having a mobile Speed Index of 3.4 seconds or faster puts a website near the top of all websites for performance.
Total Blocking Time (TBT) contribution
Total Blocking Time is the largest piece of the PageSpeed Insights formula, making up 30% of the overall score. TBT is also where we see the most performance bottlenecks for WordPress websites.
The easiest way to describe Total Blocking Time is when it feels like a web page is “stuck” or unresponsive. A web server gives a browser a list of tasks to perform, and if any of those tasks take too long to complete, it gives a hanging sensation that’s very frustrating and often results in forced browser refreshes and cracked phone screens in extreme cases.
Any task that takes over 50ms to complete is considered inefficient and will cause PageSpeed Insights to dock points from the total TBT score.
Largest Contentful Paint (LCP) contribution
LCP measures the time it takes for the largest content element, be it an image, text block, or video, to render within the viewport on a low-bandwidth mobile connection. In essence, it reflects how quickly users on slower devices see the main content of your webpage.
LCP holds significant weight (25%) in the PageSpeed Insights scoring system, highlighting Google’s priority on delivering a fast content experience. This emphasis is further reinforced by LCP’s inclusion as a Core Web Vital metric. Optimizing for LCP directly contributes to a positive user experience, especially for mobile users on limited bandwidth.
It’s essential to understand this metric measures the loading time of the largest content element within the initial viewport, not the entire webpage. This is why desktop and mobile LCP scores often differ – the content initially visible on different screen sizes can vary significantly. In essence, LCP prioritizes how quickly users see the main content they came for, especially on mobile devices with limited bandwidth.
Cumulative Layout Shift (CLS) contribution
Cumulative Layout Shift measures movement on the webpage. We’ve all tapped or clicked on a webpage only to find the button, link, or navigation menu that we clicked has moved and we end up in a totally different area than we expected. CLS is very likely to be blamed for the time I began playing a Jack Harlow music video during a church service.
The consequences of moving content are dire. Shifting content is a very frustrating experience. Google weights CLS at 25% of the PageSpeed Insights score so it’s clearly an important metric. CLS is also a Core Web Vital. Every element of a web page should remain still as the page loads to have an optimal CLS score.
Why isn’t the INP calculated as part of the PageSpeed Insights score?
We’ve discussed before about how INP is now a Core Web Vital. So why isn’t Interaction to Next Paint (INP) part of the PageSpeed Insights calculation? The main reason is that INP can’t be measured with a page scan.
INP requires an interaction to be measured. In other words, if a tool like PageSpeed Insights scans a web page, there isn’t a way for that tool to emulate a click or tap to measure INP. It’s a passive scan, not an interactive test.
In order to measure the INP a Real User Monitoring Test (RUM Test) is needed. We use DebugBear at SiteCare for our RUM Testing. Many of our WordPress Support Plan clients get access to monitoring and reporting from DebugBear so we can keep a close eye on the INP metric and make improvements.
The infamous Core Web Vitals scoring delay
Because Core Web Vitals are a cumulative measurement, it takes time for PageSpeed Insights to display the most current measurements. This delay creates lots of questions and sometimes frustration, especially after efforts have been made to improve website performance.
No one wants to wait a month to find out if the cake they baked tastes delicious.
It can take 28 days or longer for changes in Core Web Vitals to display in the PageSpeed Insights results.
Google Search Console (GSC) will typically show improvement (or decline) in their Core Web Vitals faster than a PageSpeed Insights report. The amount of traffic a website receives can also influence how quickly the GSC updates.
Real Time Core Web Vitals Tutorial
Here’s a quick video with tips on how to see real-time Core Web Vitals performance for free without signing up for a paid service.
Why PageSpeed Insights scores change so frequently
You run a PageSpeed Insights test, eager to see your website’s performance score. But then you hit “Analyze Again” just a few minutes later – and the score changes! The web page itself hasn’t magically transformed, right? So, what gives? The truth is that several factors beyond your website’s code can influence PageSpeed Insights results, and these factors can fluctuate rapidly. Let’s dive into the variables that can cause these score shifts.
Network throttling
The speed of an internet connection will impact the performance of a webpage in a huge way. ISP’s (internet service providers) in many parts of the world deliver a huge amount of bandwidth. But other locations that don’t have the supporting infrastructure only have very slow connections available.
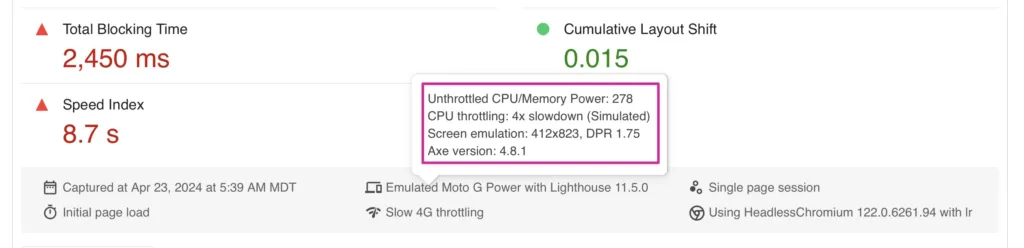
Computer resources
Believe it or not, the hardware of a computer, tablet, or smartphone plays a role in how quickly a website renders. Hovering over the device name in the PageSpeeds Insights test will show the specific hardware that Google is emulating.
Physical Test Location
Google uses four different test locations when performing a PageSpeed Insights scan.
- Northwestern US (Oregon)
- Southeastern US (South Carolina)
- Northwestern Europe (Netherlands)
- Asia (Taiwan)
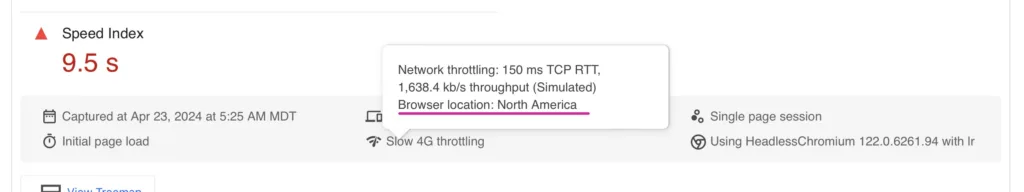
Hovering over the network information will display the physical location where the test was performed.
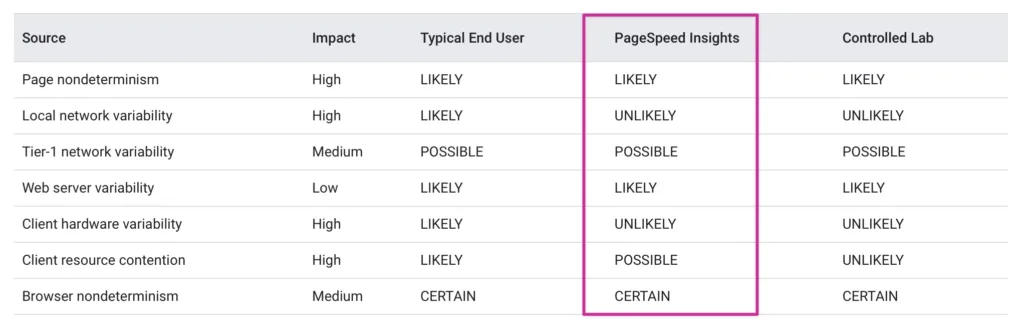
Other Variables
There are other variables that that will impact results that I’ll call “internet weather” to keep things as simple as possible. The fact is, even as reliable as the internet has become, there’s still a high amount of volatility when we start to measure website performance in milliseconds. Here’s a chart that shows the specific variables that can skew the results of any PageSpeed Insights scan, even if no changes have been made to the webpage.
The Anatomy of PageSpeed Insights Opportunities
The next section of the PageSpeed Insights report is what Google calls opportunities. This is the diagnostic information that can be used to make specific improvements to individual bottlenecks that are slowing down a website.
Here’s a screenshot displaying the different parts of the Diagnostic information and how it can be used:
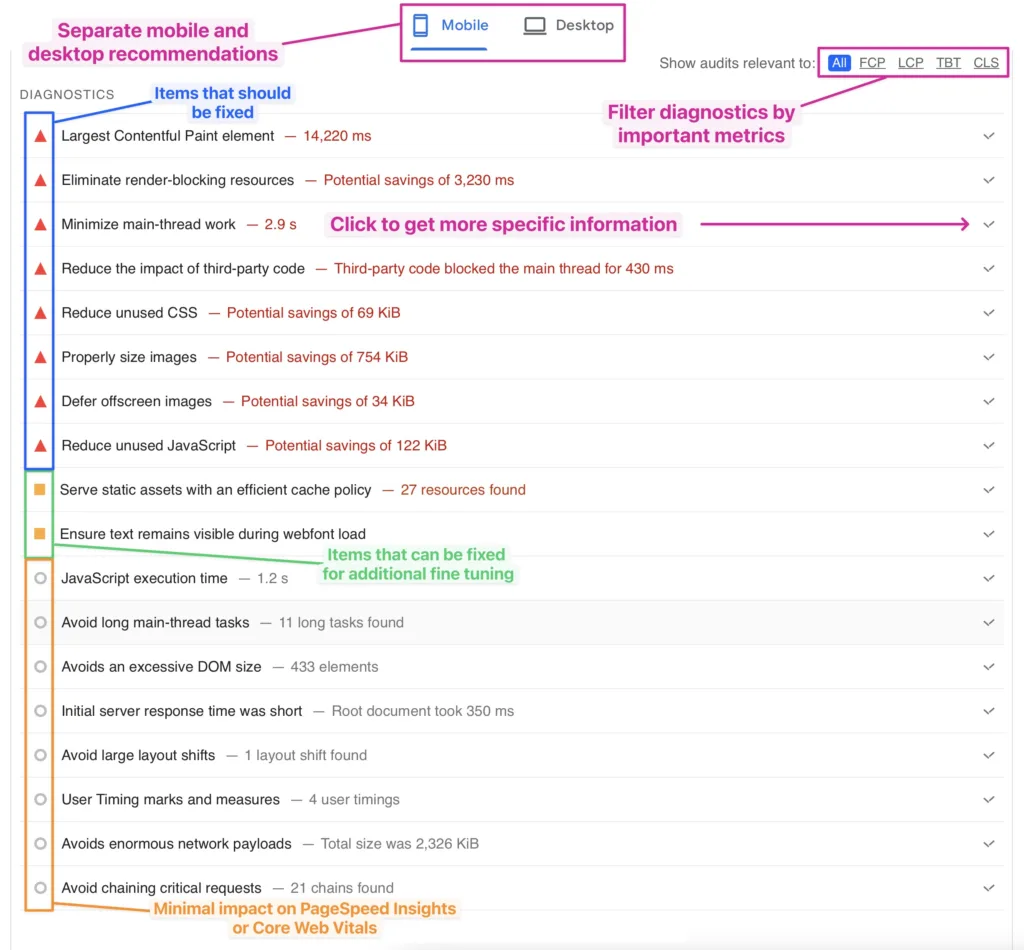
Let’s say you’re laser-focused on improving your Cumulative Layout Shift (CLS) score. Thankfully, PageSpeed Insights allows you to filter its diagnostic information, highlighting only CLS-related optimization opportunities. But remember, website performance is interconnected. Even while tackling CLS, it’s crucial to maintain a broader perspective. Many of these metrics influence each other directly or indirectly. Optimizing for CLS in isolation might have unintended consequences for other performance aspects. Therefore, keep the big picture in mind while taking advantage of PageSpeed Insights’ filtering to make targeted improvements.
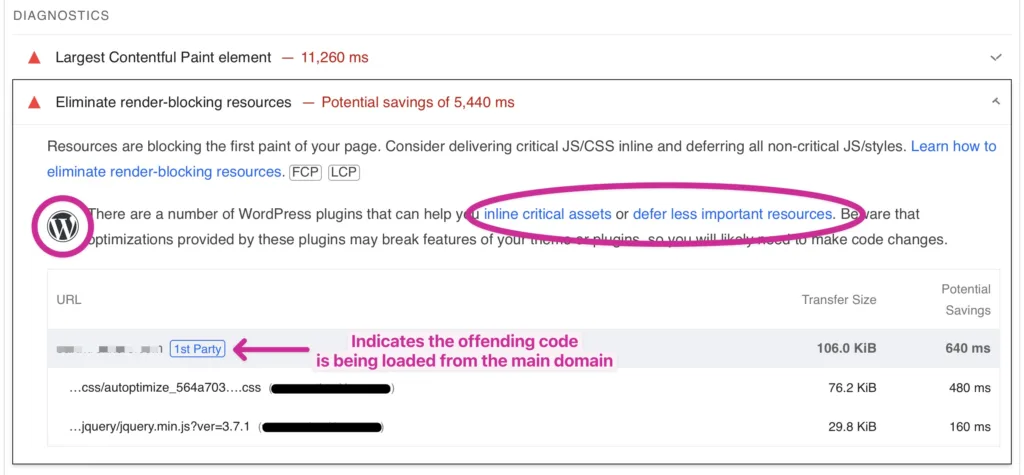
Expanding each section of the diagnostic report will uncover specific improvements, recommendations and additional education. For certain recommendations, PageSpeed Insights will even recognize the website’s platform and give links to specific WordPress plugins to address the issues that are being flagged.
Additional Resources
PageSpeed Insights can be a very useful diagnostic tool for point-in-time measurement of individual URLs, but it falls short as a holistic monitoring tool. The goal for good Core Web Vitals is to measure performance and user experience for an entire website over a longer period of time.
If you’d like to dive deeper and learn more about PageSpeed Insights and Core Web Vitals, here are some resources that I can recommend:
- WordPress Speed (and how it Impacts Core Web Vitals)
- Case Study: Core Web Vitals Case Study: How a CWV Boost Saved Falling Traffic
- Google Developer Blog
- DebugBear Blog
- Core Web Vitals: What They Are & How to Improve Them
- Site Speed Chrome Extension (for realtime CWV testing)
Measure, Monitor, and Adapt
PageSpeed Insights is one of many ways to measure web performance. As we’ve mentioned through the article it rarely tells the whole story. A much better approach to improve the user experience and boost the SEO efforts of a website is to set up continuous monitoring like RUM testing and then make adjustments as needed if Core Web Vitals start to slip.
We take that same approach to manage and improve the Core Web Vitals of all of our Gold, Platinum, and Diamond clients. We guarantee that Core Web Vitals will reach and stay at good levels. If you’d like to discuss our WordPress Care Plans or have any other general questions for our team, we’d love to hear from you.
Over half of all searches done on mobile devices are done by voice. This means that if you’re not optimizing your content for voice searches, you are missing out. The right WordPress SEO service can help you adapt your strategy so your business stays visible in voice-driven results. These are our top 4 pro tips on how to do it.


4 responses to “PageSpeed Insights: Google’s Highly Misunderstood Diagnostic Tool”
This has been in my Pocket list for a while but finally got around to it, Ryan.
Great read, clear explanations and a great resource to point people to when they show an interest in performance (which is all too rare!)
Great to hear! Glad you found it useful, Sean! And thanks for stopping by.
Great article. I like this point: Myth #4: Good desktop scores will automatically result in good mobile scores
We always try to turn for mobile primarily because good desktop performance is a bit easier to achieve since it’s more forgiving.
What are some of the ways that RUM metrics can be improved? It seems that some of our sites score great on Pagespeed Insights, but still aren’t passing CWV.
Hey Nat thanks for stopping by! We have some other articles on that very topic. Here are a few of them that going into more specifics about improving RUM test scores.
https://sitecare.com/fix-inp-for-food-publishers/
https://sitecare.com/core-web-vitals-audit/
If you have any specific questions, don’t hesitate to reach out and we’ll be happy to help out however we can!