
Google rolled out its latest Core Web Vital, Interaction to Next Paint (INP), publicly on March 12th, 2024.
A website with a good INP score is like a car with power steering. Have you ever driven a car without power steering? It’s an incredibly frustrating and physically-demanding experience. The amount of effort needed and the distance that the steering wheel needs to move for basic maneuvers is untenable. How did our forefathers (or fathers, for that matter) do it?
Visit a website suffering from poor INP scores and be magically transported to the driver’s seat of a 1996 Toyota Tercel. Every movement feels clunky and cumbersome. Tap the navigation menu, microwave some popcorn, start snacking, and then see the menu items expand. That’s why it isn’t a mystery that Google has made INP a top priority for websites, and have factored INP into their Core Web Vitals.
What is INP Exactly?
INP is the amount of time between a user interaction and the first visual change on the screen. A website with a low INP means the web page responds quickly to the majority of visitor interactions.
INP replaced First Input Delay (FID) in the Core Web Vitals formula. FID was a measure of how long it took for the website to be able to receive the first input. INP is a measure of how long the interactions actually take to complete.
This is significant because measuring INP is more complicated than the other two Web Vitals. It isn’t possible to capture INP with PageSpeed Insights, for instance. To capture an accurate INP score, use a RUM (real user monitoring) tool like DebugBear instead of PSI or GTMetrix.
Why Replace INP with FID?
FID was notoriously easy to pass, with over 90% of all websites achieving the Good threshold. However, Google could see FID’s limitations in capturing real user interactions, so they created INP. Over 90% of website visitors are spending their time on the page performing a task, not just loading the web page over and over again. FID missed the mark on measuring true user interactions because it only measured the amount of time before a web page was ready to receive input.
Because INP measures the actual user activities, Interaction to Next Paint is a much better measure of interactivity. INP creates a more clear picture of how quick and easy it is to take actions on a website, which is why it replaced FID on March 12th.
INP Benchmarks

- 🟢 An INP below or at 200 milliseconds means a web page has good responsiveness.
- 🟠 An INP between 200 and 500 milliseconds means a web page responsiveness needs improvement.
- 🔴 An INP above 500 milliseconds means a web page has poor responsiveness.
Lower INP scores are the goal. 200 milliseconds or lower represent ideal INP times and will earn the good Core Web Vitals score.
Earning a great INP score isn’t simply about improving visitor experience. Studies have shown repeatedly that lower response times increase conversion rates. The faster a web page responds, the more likely a user is to perform the desired action of that page.
Common INP Examples
Here’s a demo from Google that illustrates a slow interaction really well:
And here are some common examples of website activities that factor into INP:
- Clicking on buttons and links – Clicking on buttons and links should have a fast response time. This could include menus unfolding, new content loading, jumping to a new page section, etc. Any delay in these activities will hurt INP scores.
- Filling out forms – Text should appear immediately when completing form fields. When text is slow to appear, the entire web experience feels sluggish.
- Sliders, carousels, and galleries, oh my – Swiping seems to be one of the most unreliable gestures on the web. Sliders, specifically are saddled with UX issues. Replacing these elements entirely is often the best option to improve INP scores as well as visitor experience.
- Infinite scrolling – Delays in loading additional content defeat the original intention of infinite scrolling — to make as much content as possible available as quick as possible without reloading the entire web page. When these interactions are slow, INP scores increase (this is bad) and users find their answers on a competitor’s website.
Best Methods for Measuring INP
Low-tech INP test: Visit a website from a smartphone in a remote area with 3G and no wifi connection. How quickly does it respond? If actions feel sticky or unresponsive, the INP score is likely poor.
INP is trickier to measure than CLS or LCP. Why? Because, unlike those metrics, INP needs real user interaction to be accurately measured.
The most reliable source of INP status is the Google Search Console Core Web Vitals report. Every website owner with desires to be found on Google should register their website with Google Search Console. It’s free and it only takes a few minutes to set up.
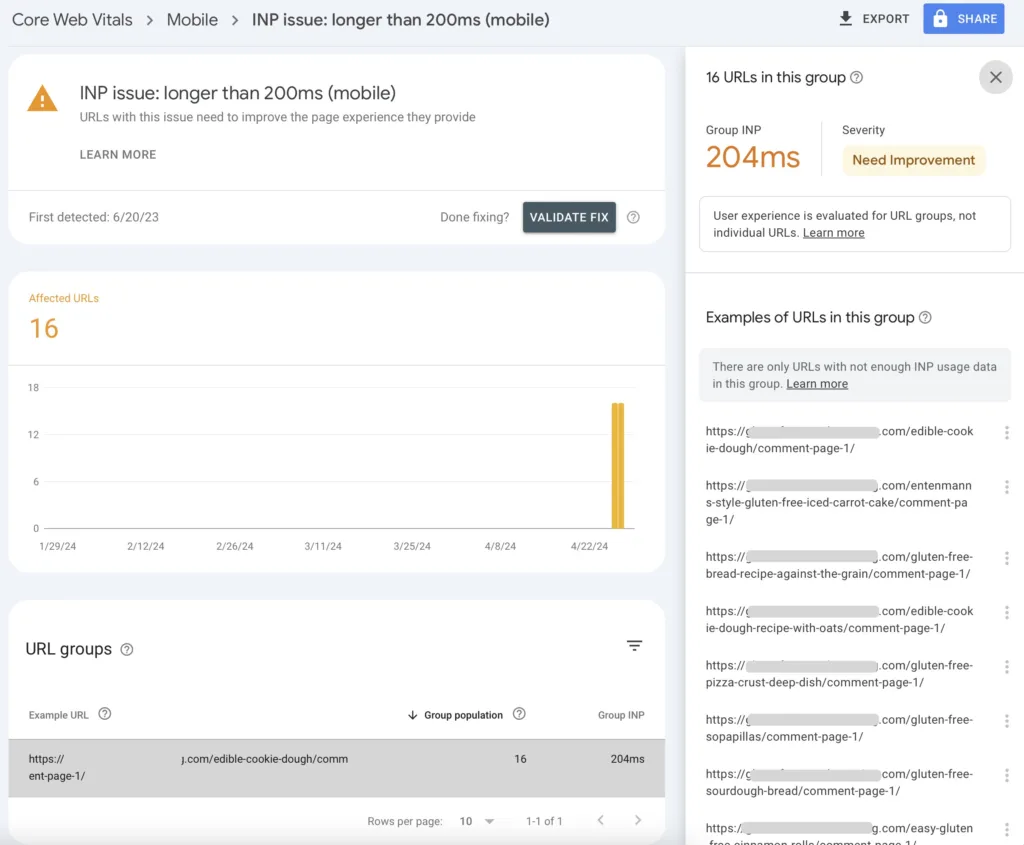
The Core Web Vitals Search Console report will flag URLs with a poor or needs improvement INP score as shown here:
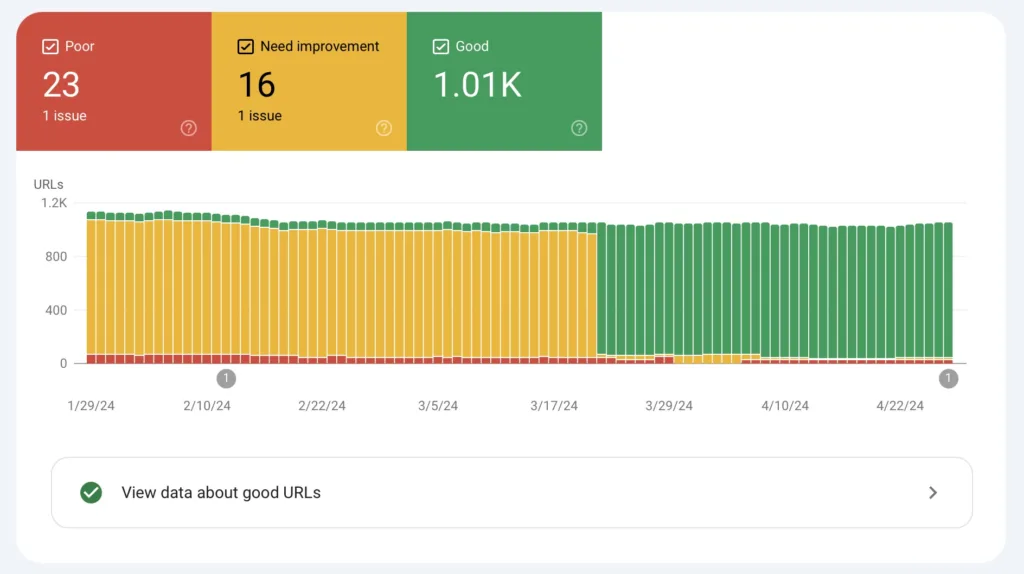
The report allows website owners to drill down into the results and get a more granular view of the specific types of pages that are impacted. Use the detailed view to spot patterns that can be improved with changes at the template or hierarchy level. This is a big time and budget savings when trying to improve these scores manually on every single URL separately.
Google Search Console Reporting Alternatives
The problem with using GSC for INP measurement is that it’s a 28-day cumulative score. Any improvements or changes that are made to INP may not be reflected in GSC for two weeks or more. Imagine trying on a pair of shoes, having them fit too tight, and then waiting a week to see if the sales associate can find a pair that fit better. This reporting delay makes the troubleshooting process way too slow when a team is actively trying to improve website performance and user experience.
That’s why RUM Testing is the best option for getting realtime INP results without the Search Console reporting delay. Here are some of the most popular RUM testing tools for realtime INP measurement.
Popular Tools for Testing Interaction to Next Paint
- DebugBear – This is what we use at SiteCare for INP monitoring and improvement. DebugBear does a great job of monitoring and reporting of all Core Web Vitals in one easy dashboard.
- SpeedCurve – SpeedCurve is the Rolls Royce of web performance testing tools. It was originally started by Steve Souders, who created the discipline of improving website performance in 2007. SpeedCurve is made by engineers formerly employed by companies like Google, Akamai, and the BBC.
- Raygun – RUM monitoring is one of several tools available with RayGun. They also have products for crash test reporting and application monitoring.
- Pingdom – Pingdom by Solarwinds started out as an uptime monitoring tool and introduced RUM monitoring clear back in 2015, which was long before it was needed to measure INP.
- Site Speed Chrome Extension – I wanted to provide at least one free option, and Site Speed Chrome Extension is a nice little tool for capturing realtime tests on a single page of a website. It captures interactions so it can give scores for INP as well. Watch this video about how to use the Site Speed Chrome extension to test INP.
The pricing for all of these tools varies, but they all follow a similar model. Website owners are charged according to usage, so a website that receives 1,000,000 page views each month will need a more robust plan than a website with 1,000 page views. Because of this, be sure to leverage features like RUM sampling so that only a portion of the site visitors are being tested. Control the number of synthetic user tests being performed each month as well. Choosing the right testing cadence and attributes without overspending is a delicate balance. Reach out to our team if you’d like some guidance.
Real User Monitoring vs Synthetic User Monitoring

Look at any of the tools and companies above and you’ll see mention of Synthetic User Monitoring as well. So what’s the difference between SUM and RUM? Synthetic User Monitoring is fake user sessions created by the tools themselves, configured according to specific parameters. For example, with SUM, I can define the frequency, browser, device, and a whole bunch of other variables that I want to test.
Real User Monitoring captures actual user data. There’s less control over what gets tested, because we can’t choose the test conditions from real people. Many of the tools listed above allow for sampling of RUM tests. This means that it’s possible to only test a random percentage of the total visitor traffic.
RUM and SUM work well together because SUM ensures that all of the possible test cases are covered, and RUM gives a clear snapshot about what’s actually happening for the audience on the website.
Common Issues with INP in WordPress
WordPress websites can struggle with achieving Good scores for Interaction to Next Paint. We’ve seen a number of people reaching out since March 12th because they weren’t aware that Core Web Vitals were changing, and their traffic has slipped due to poor INP scores, even though their LCP and CLS scores have been good.
Here are some of the most common culprits that can drag INP scores down:
- Large images and videos – This isn’t directly related to INP, but uncompressed images and videos take longer to load, which means the browser is busy downloading content instead of accepting user input.
- Heavy CSS and JavaScript – This is the most common issue that we see that impacts INP directly. Complex themes and plugins that have bloated code and lots of JavaScript slow down the rendering of the page. The browser is so busy trying to parse the messy code, it can’t respond when a visitor is trying to open a menu or fill out a form.
- Third-Party Scripts and Trackers – For a more in-depth look at how third-party scripts impact performance, in general, check out this article on the impact of ad scripts that we wrote eight years ago. Third-party trackers like HotJar have negative performance implications and have many workarounds to try and skirt the performance issues caused by their scripts.
- Server-side issues – Having the best WordPress hosting is a quick and relatively inexpensive solution to boosting all of the Core Web Vitals for a website. Slow server response times don’t directly impact Interaction to Next Paint, but it’s also impossible for the website to accept user input if the server is responding slowly.
All of these challenges can be tricky to navigate and address which is why we’ve built our Core Web Vitals guarantee into our SiteCare plans.
Address Interaction to Next Paint Today
Everyone wants a super-responsive website, and INP is the metric that really tells the story of how good (or bad) it is to use a website. Please take one minute today and check your Google Search Console Core Web Vitals report. How does your website measure up? If the report is showing lots of orange and red, contact our team of web performance experts for a free consult. As part of our mission to make website owners proud of their websites, we’re happy to offer some direction on where to focus optimization efforts. And for those who want this problem solved, our SiteCare plans are tough to beat.


Leave a Reply